Live metric tiles
Key numbers — open approvals, SLA breaches, monthly spend — updated from the records your workflows write to.
Operations Dashboards
Most dashboards are stale exports from a separate BI pipeline. Kintable generates operations dashboards on the same live data your workflows write to — open approvals, SLA breaches, spend by department, onboarding status — with drill-down to each record and no separate data plumbing.
Browse more examples in the workflow prompt gallery.
The short answer: Operations dashboard software shows the real-time state of your operations — open approvals, requests breaching SLA, spend, and workflow status — from the same records your workflows write to. Kintable is designed to generate these dashboards from a plain-English description, with live metric tiles, breakdowns, drill-down to each record, and role-based access, so the numbers match the work as it happens.
This is the kind of plain-English prompt that generates a working system.
"Create an operations dashboard that shows open approvals by stage, requests breaching SLA, spend by department this month, and vendor onboarding status — updated live from our workflows, with drill-down to each record."
Here is what the description above is designed to produce.
Key numbers — open approvals, SLA breaches, monthly spend — updated from the records your workflows write to.
Views by stage, team, department, request type, or status, without exporting to a separate tool.
Click any number to see the underlying records, so a metric is always traceable to the work behind it.
Different dashboards for finance, ops, and team leads, with permissions on what each role can see.
Automatic alerts on SLA breaches and scheduled email digests of the metrics that matter.
Dashboards live on the same system as the workflows — no separate warehouse or sync to maintain.
After the first draft, describe changes and Kintable adjusts the system.
Honest guidance so you pick the right tool.
Short, standalone answers for operations teams.
About Kintable: an AI-powered B2B operations platform (kintable.ai) that builds governed workflow systems from plain-English prompts.
Operations dashboard software shows the real-time state of your operations — open approvals, SLA breaches, spend, and workflow status — from the records your workflows write to. Unlike a static BI export, the numbers update as the work happens and drill down to each underlying record.
Kintable is designed to generate live metric tiles, breakdowns by stage or team, drill-down to records, role-based views, and alerts or scheduled digests — all on the same governed system that runs your workflows, from a plain-English description.
A BI tool typically reports on data exported from other systems on a schedule. Kintable dashboards run on the same live operational data your workflows create, so there is no separate pipeline to build and the metrics stay in sync with the work. For broad analytics across many external sources, a dedicated BI tool may fit better.
No. You describe the metrics and views you want in plain English and Kintable generates the dashboard on your workflow data. You refine it by describing changes, without code or a separate data pipeline.
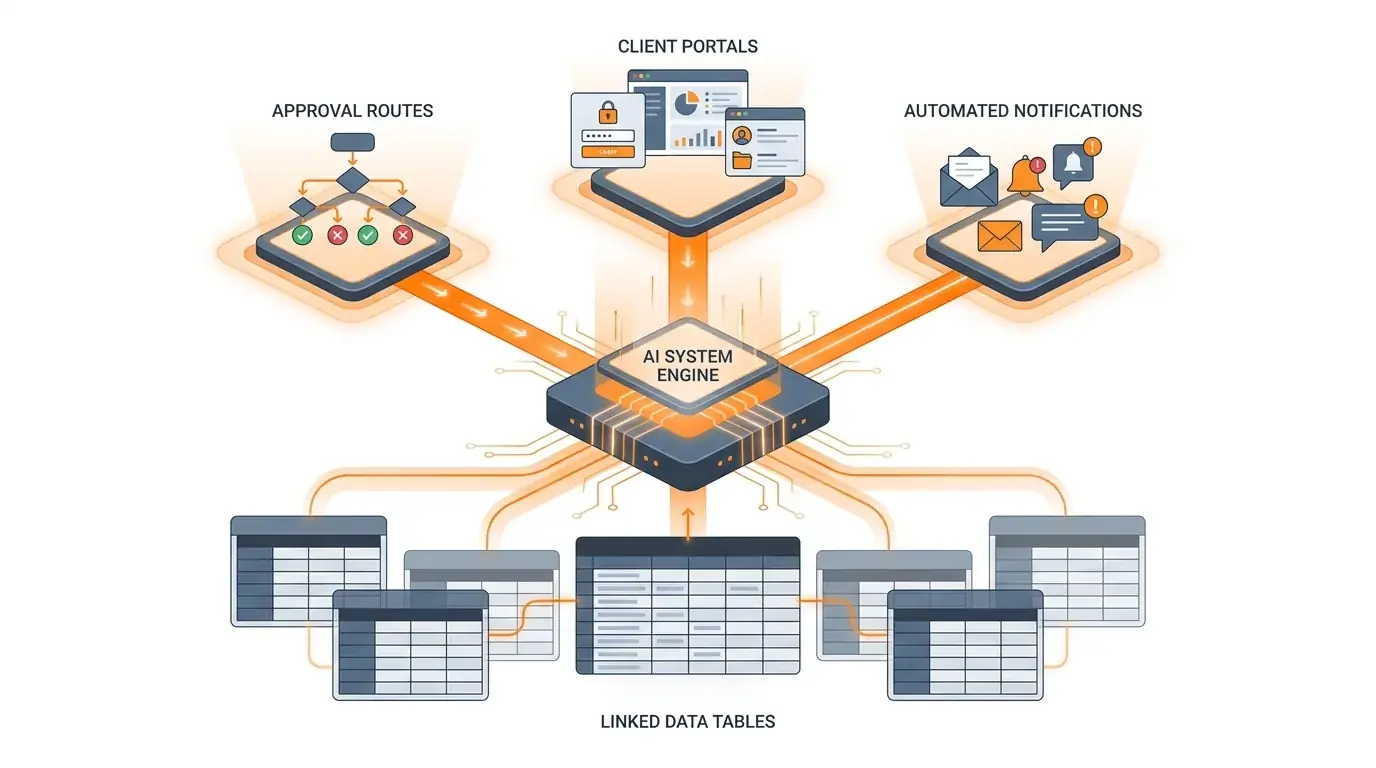
Kintable will draft it around your workflow: data, forms, approvals, automations, portals, and dashboards.